
Client Service Performance Dashboard
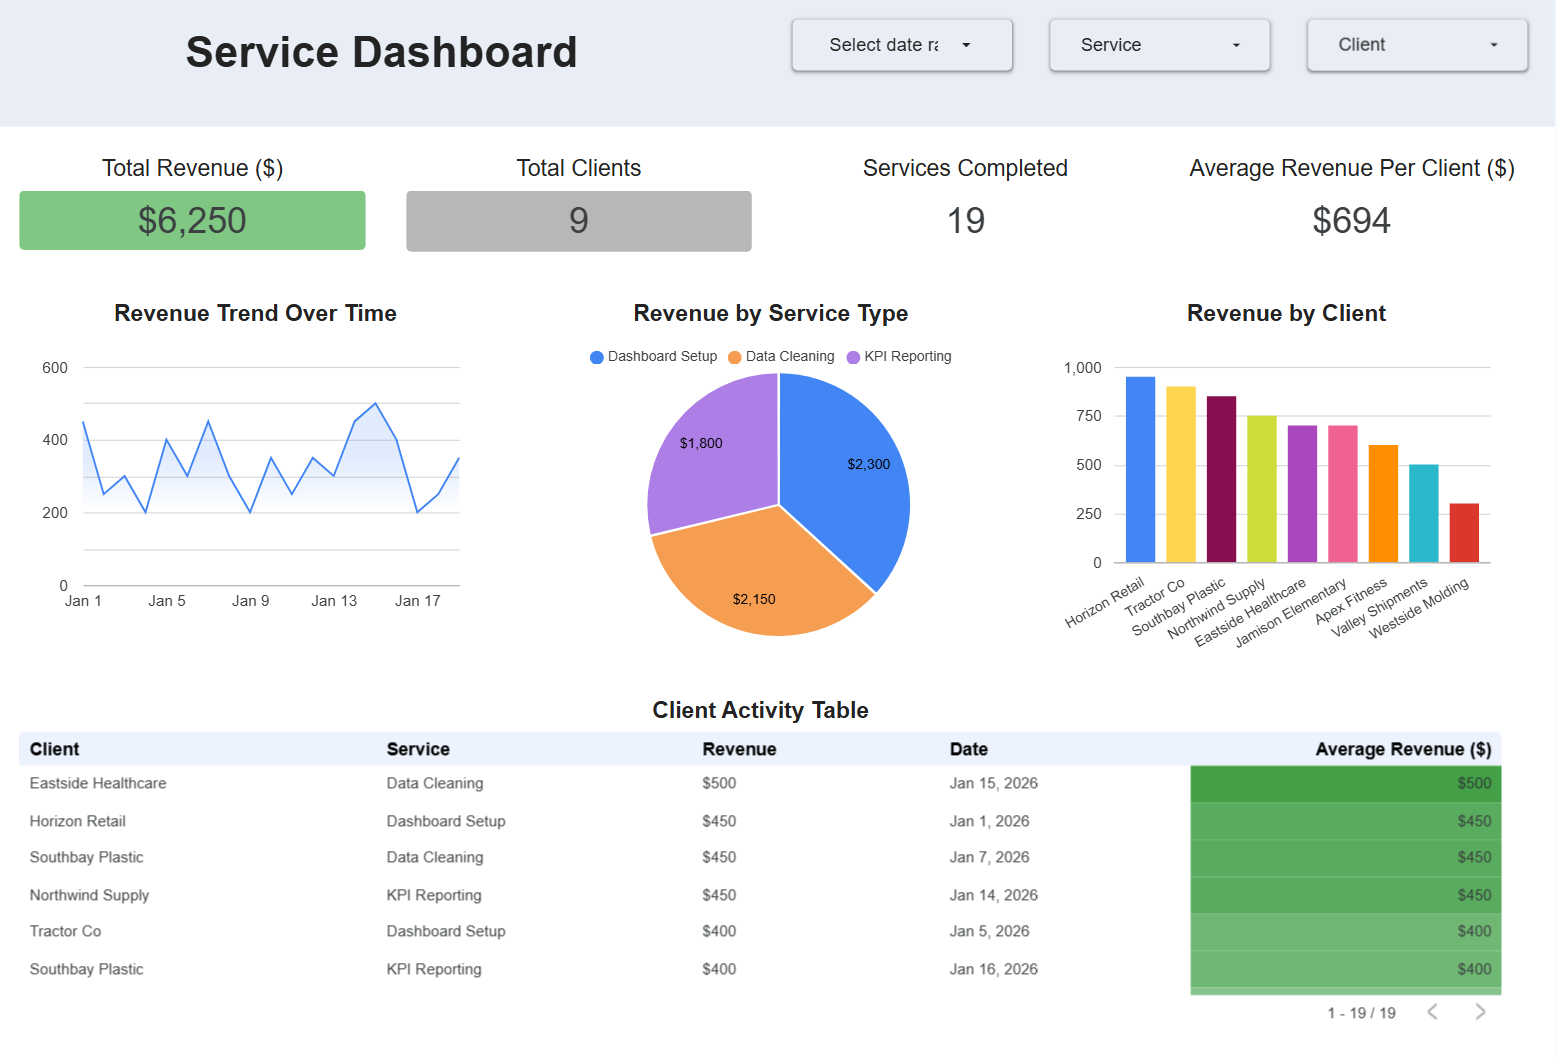
This dashboard was designed to help monitor client activity, service performance, revenue trends, and operational workload through centralized reporting and interactive analytics.
Client Service KPI Overview
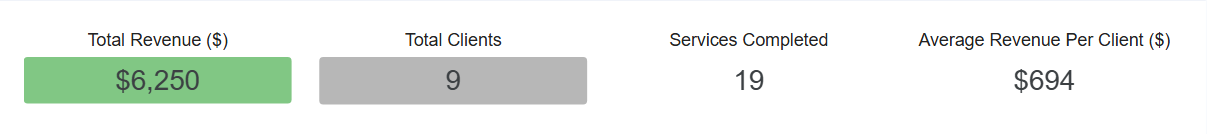
The KPI section provides a quick overview of operational performance including total revenue, active clients, completed services, and average client value.
Revenue Trend Tracking
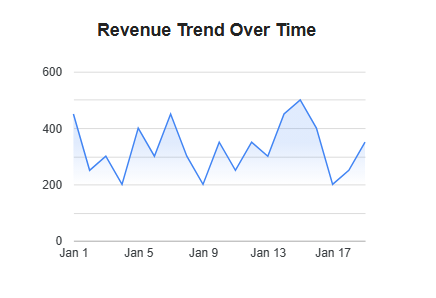
Time-series reporting helps visualize revenue performance over time and identify business growth patterns, workload fluctuations, and operational trends.
Client-Level Performance Analysis
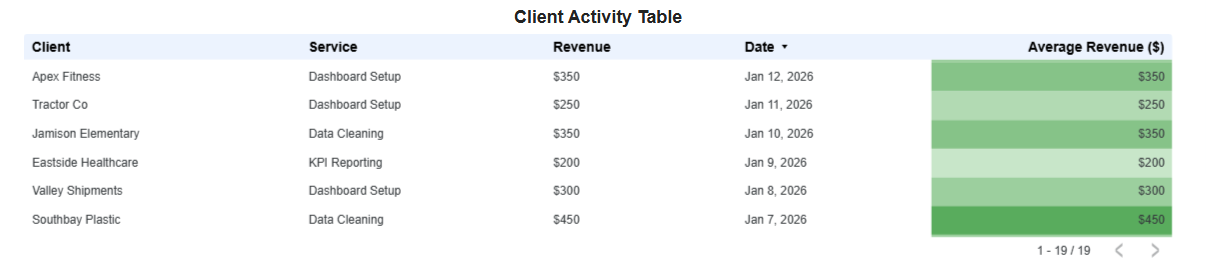
Client reporting highlights which customers generate the highest revenue and service activity across the business.
Service Category Reporting
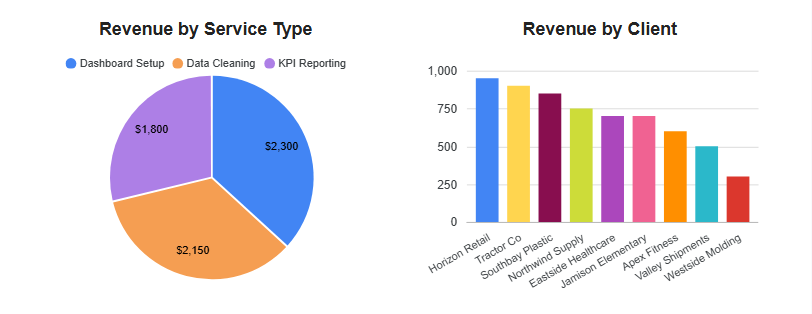
Service-level reporting helps identify which offerings contribute most to operational activity and overall revenue performance.
Interactive Filtering & Drilldown
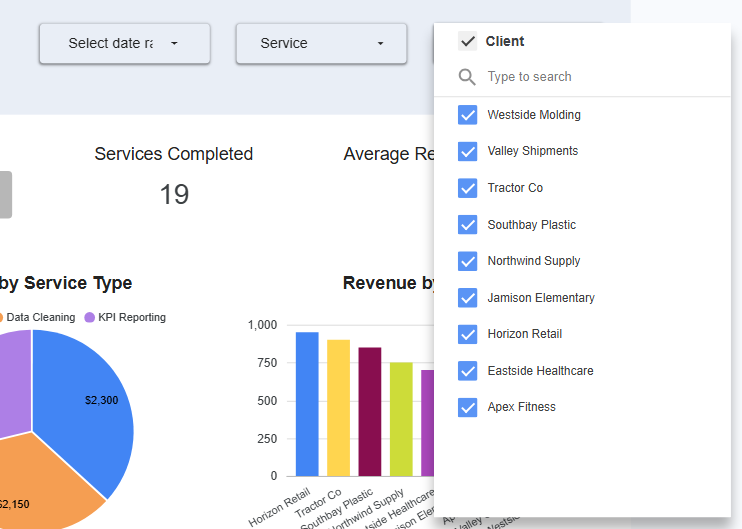
Interactive controls allow users to dynamically filter reporting by service category, client, or time period for more focused operational analysis.
The goal of this dashboard is to simplify operational visibility by centralizing client activity, service reporting, and revenue tracking into a clear and interactive reporting system.